Remember the need we are trying to answer is: “I want to know if I should bet or not!”
Easiest solution is a YES/NO output, but really?
Welcome to Part 2:
We will
Import your table to Tableau
Map coordinates
Wait! What?
Yes Tableau has a nifty X/Y method that allows you to map out your image and it is a must for this process.
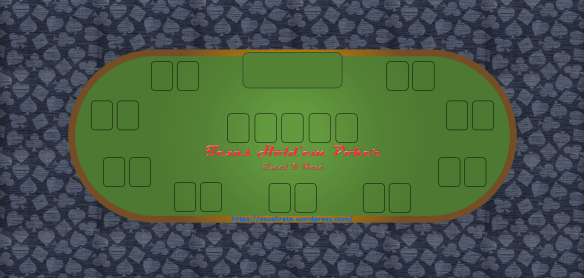
Be sure you have saved your Excel Poker Table as a png ( you can use the Windows Snipping Tool)
YouTube walk-through
1 Create a data set in Excel that you can reference — 3 columns
- Position
- X
- Y

2 Open the Poker Table in Paint and look at the properties

3 Copy the Width and Height in pixels and enter into Excel

Save the Excel file so it can be used as a Tableau Data Source
4 Connect to that data source

5 Open a new worksheet and go to the Map tab at the top of the screen
Select Background images
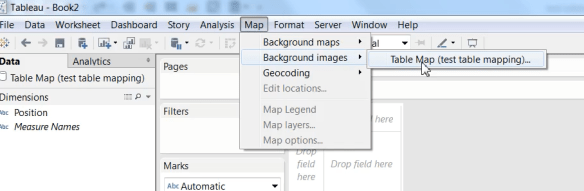
6 Add your image
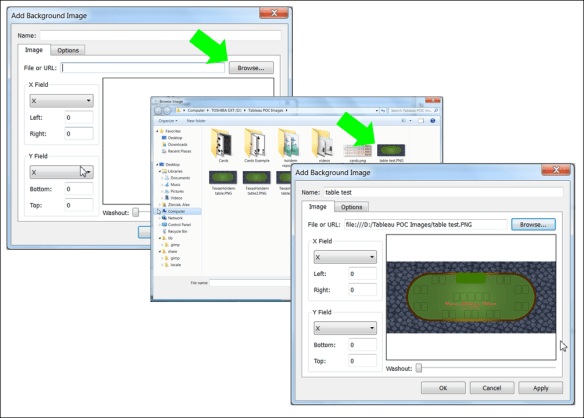
7 Place the X/Y pixel counts into the image as X = the right most position and Y = the top most position

8 Create a cross tab with X as column and Y as rows
Things to consider:
In Map >> Background Images be sure you have “Always show Entire Image” selected
Be sure you select “X” and “Y” when you enter your data
You will now see your Texas Hold ’em table

You can hide the headers to make a clean worksheet

Up next –> Tableau Hold ’em Part 3
Previous steps:
https://excelirate.wordpress.com/2017/09/05/tableau-holdem-series/
https://excelirate.wordpress.com/2017/09/18/tableau-hold-em-part-1-the-flop-card-1/