I want to know if I should bet or not!
Ok, so anyone can look up odds and probabilities…
An Excel spreadsheet can quickly tell you if your hand, position at the table, amount in the pot, etc. is good and the likely value
Great!
If you are like me, and like spreadsheets do not continue–you are done, you do not need the rest
The Rest…
Ok, you stayed?
First things first–we are talking Texas Hold ’em Poker. Some of you may understandably disapprove of gambling. I am using it as an example of understanding probability and/or statistics to drive informed, and hopefully, better decision making!
Secondly — People like to understand data in context. Actually all data must be used in context to have meaning. If I am playing poker, I want to see the hand value and see it in the position where I am sitting.
While I can do this in the abstract table, why not actually make a table?
Step 1: Make a table
(videos below)
The beauty is you do not need anything fancy–if you have Excel, use it. I do so in this video tutorial. Are there better ways? Sure.
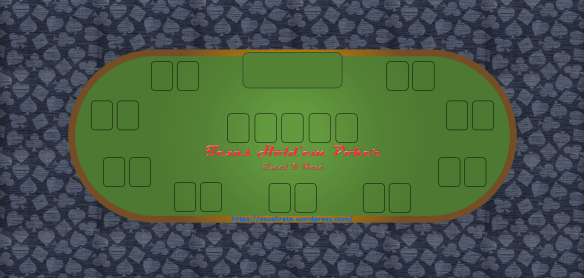
The table will be where I will present the data in the actual context that is immediately understandable. The Tableau Viz will also aim make the data more actionable.
Steps involved– (Note I used Excel for the steps below as there is no need for fancy photo editing software)
1 Snag an Image of “Casino Carpet”
— google it and be warned, this is educational, if building for a client you may want to get the rights
 2 Layout the Floor
- Copy the image into Excel or your preferred software
- Repeat the image to tile out the floor
3 Create a Table
- Insert >> Shapes: select the Rounded Corner Rectangle
- Adjust the curved edges
- Select Gradient for the color fill and the outline
4 Add the Dealer and Card Locations
- Insert >> Shapes: select the Rounded Corner Rectangle
- Set Fill to No Fill
- Set Line to Black
- Copy and paste these to create location for the cards
5 Place the Table on Your Floor
- Once your table is made place it on the floor
- Copy the entire image
- Either with a snipping tool
- Group in Excel then copy and paste into an editor
- Save image to be used with Tableau
I tend to save in multiple formats — for the rest of the tutorial I will be using .png
You have made your table, now what?
Next week click over to setting up tableau in Tableau Hold ’em Part 2
Please leave comment in my YouTube and WordPress blog. I do not claim to be following best practices here so please be positive. Share if you see value. Ignore if you don’t.

Pingback: Tableau HOLD ’em | Excel-i-rate
Pingback: Tableau Hold ’em — Part 2 — The Flop Card 2 | Excel-i-rate